Evaluation Criteria for the Leaderboard 2.1
The information on this page concerns the Leaderboard 2.1, the latest version. For information about other versions please consult the older versions section.
You can find below the details about the different participation modalities for the leaderboard along with the evaluation metrics used to score the AV stacks and the results provides at the end of the simulation.
Index
Participation modalities
The leaderboard offers two participation modalities, SENSORS and MAP. These modalities differ in the type of input data that your agent can request from the platform.
Additionally, agents in both modalities will receive a high-level route description indicating the key points that the path has to follow in order to reach the destination. The route is represented as a list of tuples and has two variations.
For the first case, the first element of the tuple contains a waypoint, expressed as a latitude, a longitude, and a z component.
[({'z': 0.0, 'lat': 48.99822669411668, 'lon': 8.002271601998707}, RoadOption.LEFT),
 ({'z': 0.0, 'lat': 48.99822669411668, 'lon': 8.002709765148996}, RoadOption.RIGHT),
 ...
 ({'z': 0.0, 'lat': 48.99822679980298, 'lon': 8.002735250105061}, RoadOption.STRAIGHT)]
The second case is very similar to the previous one, but instead of using GPS coordinates, the route is expressed in world coordinates instead.
[({'x': 153.7, 'y': 15.6, 'z': 0.0}, RoadOption.LEFT),
 ({'x': 148.9, 'y': 67.8, 'z': 0.0}, RoadOption.RIGHT),
 ...
 ({'x': 180.7, 'y': 45.1, 'z': 1.2}, RoadOption.STRAIGHT)]
The distance between two consecutive waypoints could be up to hundreds of meters. Do not rely on these as your principal mechanism to navigate the environment.
The second element contains a high-level command. The set of available high-level commands is:
- RoadOption.CHANGELANELEFT: Move one lane to the left.
- RoadOption.CHANGELANERIGHT: Move one lane to the right.
- RoadOption.LANEFOLLOW: Continue in the current lane.
- RoadOption.LEFT: Turn left at the intersection.
- RoadOption.RIGHT: Turn right at the intersection.
- RoadOption.STRAIGHT: Keep straight at the intersection.
There might be cases where the semantics of left and right is ambiguous. In order to disambiguate these situations, you could consider the GPS position of the next waypoints.
Important: You are not allowed to make use of any privilege information offered by the CARLA simulator, including planners or any type of ground truth. Submissions using these features will be rejected and teams will be banned from the platform.
SENSORS track
On this track agents can request access to the following sensors.

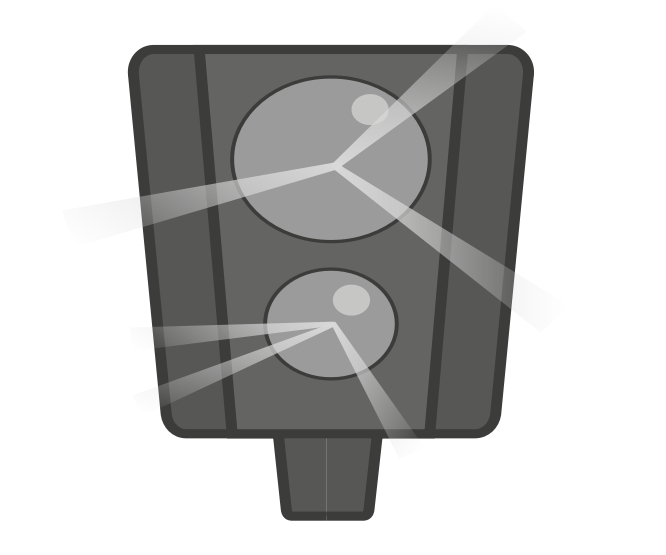
RGB camera |
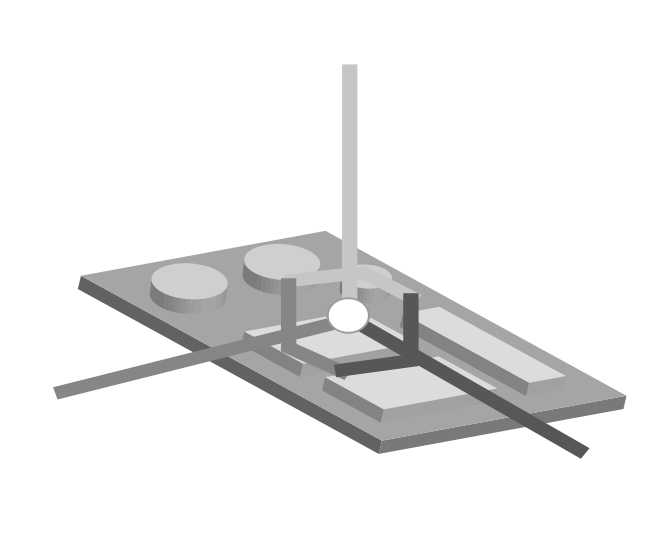
LIDAR |

RADAR |
GNSS |
IMU |
Speedometer |
| Sensor specs | Sensor specs | Sensor specs | Sensor specs | Sensor specs | - |
| 0-8 units | 0-2 units | 0-4 units | 0-1 units | 0-1 units | 0-1 units |
| Regular camera that captures images. | Velodyne 64 LIDAR. | Long-range RADAR (up to 100 meters). | GPS sensor returning geo location data. | 6-axis Inertial Measurement Unit. | Pseudosensor that provides an approximation of your linear velocity. |
Units of each sensor are limited to keep the computational budget under control.
MAP track
Provides the same set of sensor as the SENSORS track does. Additionally, agents can request access to an HD map, which is provided as an OpenDRIVE file parsed as a string.
You are fully responsible to parse or convert this file into a representation that can be useful to your agent.
|
RGB camera |
LIDAR |
RADAR |
GNSS |
IMU |
| Sensor specs | Sensor specs | Sensor specs | Sensor specs | Sensor specs |
| 0-8 units | 0-2 units | 0-4 units | 0-1 units | 0-1 units |
| Regular camera that captures images. | Velodyne 64 LIDAR. | Long-range RADAR (up to 100 meters). | GPS sensor returning geo location data. | 6-axis Inertial Measurement Unit. |
OpenDRIVE map |
Speedometer |
| - | - |
| 0-1 units | 0-1 units |
| Pseudosensor that exposes the HD map in OpenDRIVE format parsed as a string. | Pseudosensor that provides an approximation of your linear velocity. |
Qualifying tracks
The Leaderboard 2.1 features 2 qualifying tracks in which your agent will be required to safely navigate a straightforward route through an unseen map featuring simple driving scenarios. Each of the SENSORS and MAP tracks has its own respective qualifier. You must reach a minimum driving score in the qualifiers to be permitted to submit agents to the Leaderboard 2.1 main tracks.
The qualifiers permits a more restrictive sensor suite than the main competition:
- RGB cameras: Limited to 4.
- RADAR: Limited to 2.
- LIDAR: Limited to 1.
- GNSS, IMU, Speedometer and Opendrive map: Unchanged, limited to 1.
We encourage you to use the qualifier to ensure that your AD stack is properly configured and functioning correctly with the Leaderboard.
Evaluation and metrics
The driving proficiency of an agent can be characterized by multiple metrics. For the leaderboard we have selected a set of metrics that help understand different aspects of driving. While all routes have the same type of metrics, their respective values are calculated separately. The specific metrics are as follows:
-
Driving score: \(R_i P_i\) — Main metric of the leaderboard, serving as the product between the route completion and the infractions penalty. Here \(Ri\) is the percentage of completion of the \(i_{th}\) route, and \(Pi\), the infraction penalty of the \(i_{th}\) route. Has a maximum value of 100.
-
Route completion: \(R_i\) - Percentage of the route distance completed by an agent. Has a maximum value of 100.
-
Infraction penalty: \(P_i\) - The leaderboard tracks several types of infractions and this metric aggregates all of the ones triggered by an agent. Agents start with an ideal base score of 1.0 and each infractions reduces it down to a minimum value of 0.
When all routes have been completed, a global metric for each of the previous three types is also generated, being the arithmetic mean of all the individual routes combined. The global driving score is the main metric on which you will be classified with respect to other participants.
Note that the arithmetic mean nature of the global metrics results in the global driving score not being the product of the global route completion and the global infraction penalty.
Infractions
The CARLA leaderboard offers individual metrics for a series of infractions. Each of these infractions has a specific coefficient based on their severity and are aggregatted into the infraction penalty formula:
\[P_i = \frac{1}{1 + \sum_j{c_j*\text{#infractions}_j}}\]Infractions related to collisions and failure to comply with traffic regulations, ordered by severity:
- Collisions with pedestrians —
1.0. - Collisions with other vehicles —
0.70. - Collisions with static elements —
0.60. - Running a red light —
0.40. - Failure to yield to emergency vehicle —
0.40. - Running a stop sign —
0.25.
Some scenarios feature behaviors that can block the ego-vehicle indefinitely. These scenarios will have a timeout of 4 minutes after which the ego-vehicle will be released to continue the route. However, a penalty is applied when the time limit is breached:
- Scenario timeout —
0.4.
The agent is also expected to maintain a minimum speed in keeping with nearby traffic. The agent’s speed will be compared with the speed of nearby vehicles and failure to maintain a suitable speed will result in a penalty:
- Failure to maintain minimum speed — Up to
0.4, dependent on the magnitude of the speed difference and applied every time a quarter of the route is completed.
Besides these, there is one additional infraction which doesn’t have a fixed coefficient.
- Off-road driving — If an agent drives off-road, that percentage of the route will be reduced from the infraction penalty, cancelling out the one gained through the route completion. In other words, driving off-road results in no change in driving score.
Shutdown events
Additionally, some events will interrupt the simulation, preventing the agent to continue. In these cases, the route which is being simulated will be shut down, and the leaderboard will move onto the next one, triggering it normally.
- Route deviation — If an agent deviates more than
30meters from the assigned route. - Agent blocked — If an agent doesn’t take any actions for
180simulation seconds. - Simulation timeout — If no client-server communication can be established in
60seconds. - Route timeout — If the simulation of a route takes too long to finish.
- Agent errors — If the agent code results in an error.
Any other errors that might occur during the simulation such as unexpected behaviors from the leaderboard, disconnections from the server or others will result in the shut down of the leaderboard and the storage of the partial results of the route, flagging them as crashed. The leaderboard has the capabability to resume unfinished simulations, repeating the last ‘crashed’ route and moving onto the rest.
Results
At the end of each route, the leaderboard will output information about the performance of your AV stack as a json file. This includes general information about the route, an overview of the infractions commited by your agent, the scores for that route and information about its duration. Below is an example of a route where the agent both run a red light and deviated from the route.
{
    "index": 0,
    "route_id": "RouteScenario_0_rep0",
    "status": "Failed - Agent deviated from the route",
    "num_infractions": 2,
    "infractions": {
        "collisions_layout": [],
        "collisions_pedestrian": [],
        "collisions_vehicle": [],
        "red_light": [
            "Agent ran a red light 203 at (x=341.25, y=209.1, z=0.104)"
        ],
        "stop_infraction": [],
        "outside_route_lanes": [],
        "min_speed_infractions": [],
        "yield_emergency_vehicle_infractions": [],
        "scenario_timeouts": [],
        "route_dev": [
            "Agent deviated from the route at (x=95.92, y=165.673, z=0.138)"
        ],
        "vehicle_blocked": [],
        "route_timeout": []
    },
    "scores": {
        "score_route": 25.4,
        "score_penalty": 0.8,
        "score_composed": 20.32
    },
    "meta": {
        "route_length": 530.846,
        "duration_game": 85.55,
        "duration_system": 21.034
    }
}
Each time a route is completed the leaderboard adds a new entry to the json file. Once they are all finished, the global scores will be calculated. The global infractions compress the individual route’s data into a single value and is given as the number of events per Km. The global section also includes the standard deviations of the evaluation metrics.